System of Linear Inequalities
This is a graph of a linear inequality:
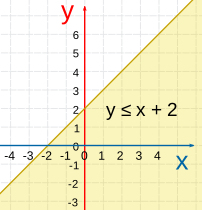
The inequality y ≤ x + 2
We can see the y = x + 2 line, and the shaded area is where y is less than or equal to x + 2
Linear Inequality
A Linear Inequality is like a Linear Equation (such as y = 2x+1) ...
... but it will have an Inequality like <, >, ≤, or ≥ instead of an =.
System of Linear Inequalities
We can have more than one inequality, which makes it a system of inequalities.

A System of Linear Inequalities
The Inequality Grapher handles them beautifully, give it a try.
Is a Point Within the Inequalities?
We simply check that the point satisfies each inequality.
Is the point (3,1) within these inequalities?
Check: y ≤ x + 2:
Try (3,1):
1 ≤ 3 + 2
1 ≤ 5
That's True!
Let's check the other inequality y ≥ −x/2:
Try (3,1):
1 ≥ −3/2
1 ≥ −1.5
That's also True!
Both inequalities are true, so the point is within the system of linear inequalities.