Introduction to Linear Programming
Linear Programming can find the best outcome when our requirements are defined by linear equations / inequalities (basically straight lines).

Example:
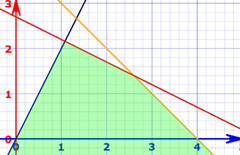
This graph has "restrictions": the three lines and the x and y axes.
The colored area is the "feasible region".
If our objective is to maximise the y value, we can see that:
An x-value around 1.1 gets us the maximum y-value around 2.1
Note:
- The restrictions are also called constraints or requirements
- The objective or best outcome is what we're trying to optimize, such as maximizing profit or minimizing cost.
- All constraints, and our objective, have to be linear equations (ie lines).
And "Planning" is maybe a better word than "programming" (which was chosen before computer programming was common).
Linear programming can help us tackle complex decisions in manufacturing, transport, finance etc, when faced with things like varying costs, manpower, supplies and sales levels.
It simplifies the decision-making process by defining clear objectives and considering all constraints to find the most efficient solution.
Solving
We can solve simple two-variable questions using the Graphical Method:
Plot the constraints on a graph to create a "feasible region", find each vertex (corner point), then calculate the value of our objective at those points.
We can then choose the maximum or minimum as desired.
Example: Farm Robot Makers
A company makes farm robots that control weeds.
- There are two models: BigPal and SlimGuy
- They have 2 crews: mech (mechanical) and elec (electrical)
- BigPal takes 5 hours of mech and 3 hours of elec to make
- SlimGuy takes 4 hours of mech and 4 hours of elec
- The mech crew have 80 hours available per day, the elec only 60 hours
- BigPal gets $300 profit each, SlimGuy $350 each.
How many should they make each day?
Let's use b for BigPal and s for SlimGuy
- For mech workers: 5b + 4s ≤ 80
- For elec workers: 3b + 4s ≤ 60
It is also fair to say that neither b nor s can be less than 0
So we get this graph:
The polygon has corner points (0,0), (16,0), (10,7.5) and (0,15)
The Fundamental Theorem of Linear Programming says the maximum (or minimum) value of the objective function will be at one of those points, so let's check each one!
Our maximum profit is when we produce 10 BigPals and 7.5 SlimGuys each day.
(Yes, 7.5 isn't a whole number, so some days there will be a half-finished robot on the shop floor!)
Some tools that might help you are the Equation Grapher (where you can enter things like "3x+4y=60") and the Inequality Grapher.
Note: for more difficult questions where graphing is not practical there is the Simplex Method. It has many steps, but all using basic arithmetic. We don't cover it here, but there are many explanations on the interweb.
Uses For Linear Programming
- Production Planning: Manufacturers use it to find the best product mix that maximizes profit within their resource limits, like raw materials and machine hours.
- Agriculture: Farmers apply it to allocate land for crops efficiently, aiming to boost profit by considering soil quality, water supply, and demand.
- Transport: Companies optimize routes so as to transport goods cost-effectively, factoring in fuel costs, vehicle capacity, and delivery deadlines.
- Energy Management: Power companies strategically distribute energy production to satisfy demand while reducing costs and cutting emissions.
- Healthcare: Hospitals use it to manage staff, equipment, and patient needs effectively while adhering to constraints such as staff hours and budgets.
- Finance and Investment: Financial institutions optimize portfolios with it to meet return goals and minimize risk, accounting for interest rates and market conditions.