Real World Graph
The Challenge
Take something in the real world and produce a graph about it!
Example: The Ride
You leave home and walk for 5 minutes to the bus stop, covering 900m.
Wait at the bus stop for 7 minutes.
Take a bus ride for 8 minutes to get to the shops, covering 8,500m.
And here's the graph:
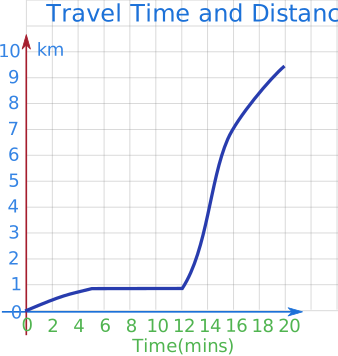
How to Sketch a Story
- Choose your Axes: Usually, Time goes on the bottom (x-axis) and Distance, Population, Dollars, Height (whatever you are interested in) goes on the side (y-axis)
- Mark the "Anchor Points": Work out the specific moments in the story. In the example:
- Start: (0, 0)
- End of walk: (5, 900)
- End of wait: (12, 900) - the time increased, but the distance didn't!
- End of bus ride: (20, 9400) - total distance is 900 + 8500.
- Connect the dots: Think about the shape. A steady walk is a straight line. A speeding bus will be a steeper line!
When a graph shows distance change over time:
- A flat horizontal line means stopped (time is passing, but distance isn't changing), not flat ground
- A downward line means you are heading back toward your starting point, not walking downhill
Now it is Your Turn!
Work out your subject of interest, something from your daily life (walks, phone battery, cooking, exercise), a news story, local wildlife (birds, ants), prices, anything!
Try to imagine the shape of the graph first:
- A steady thing like walking, or a tap into a cup, will have a smoothly rising (linear) line
- A leaking bucket will start off falling fast, then slow down as the bucket empties
- Rain can fall steady, or in great bursts
- Throwing a ball against a wall and catching it. The distance from you goes up, then immediately comes back down
The "Master" Challenge
Have a Non-Linear relationship in your graph. This is where the line isn't straight. Think of something that speeds up, like a ball rolling down a steep hill, or slows down, or rises and falls smoothly.